
A review of the Snug Harbor POA 2025 Profit & Loss Budget vs. Actual report shows the association finishing the year in a solid financial position, with several notable strengths worth highlighting.
Overall, the results reflect disciplined cost control, stable revenue streams, and a year-end financial outcome that exceeded expectations.
Strong Net Income Performance
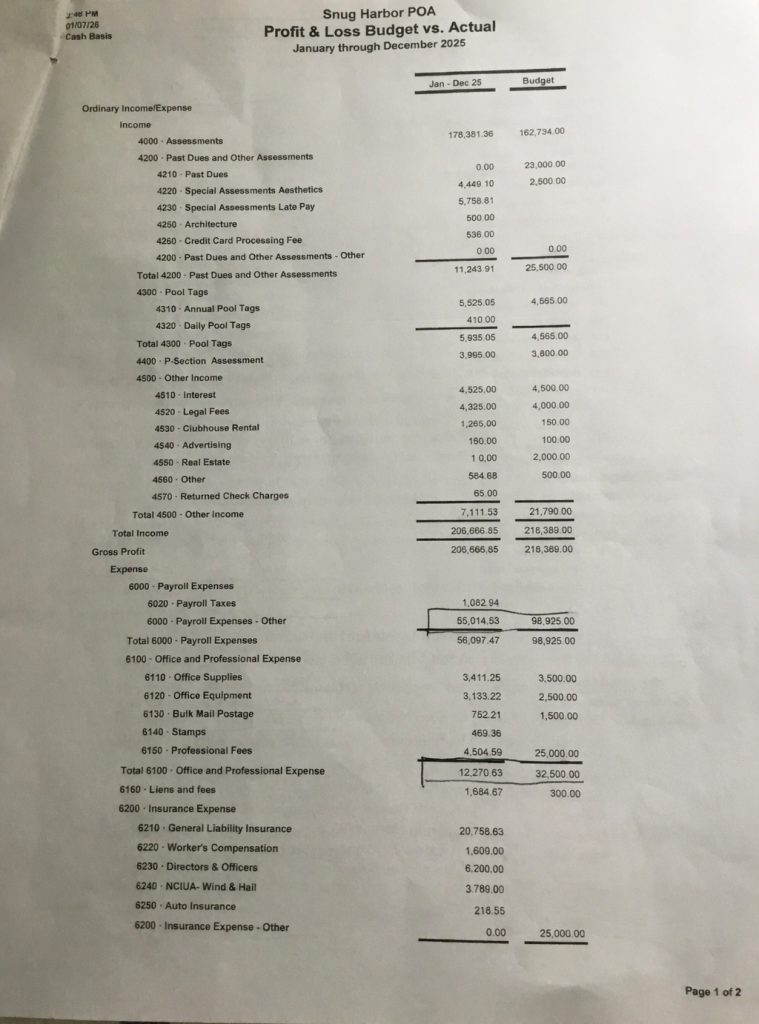
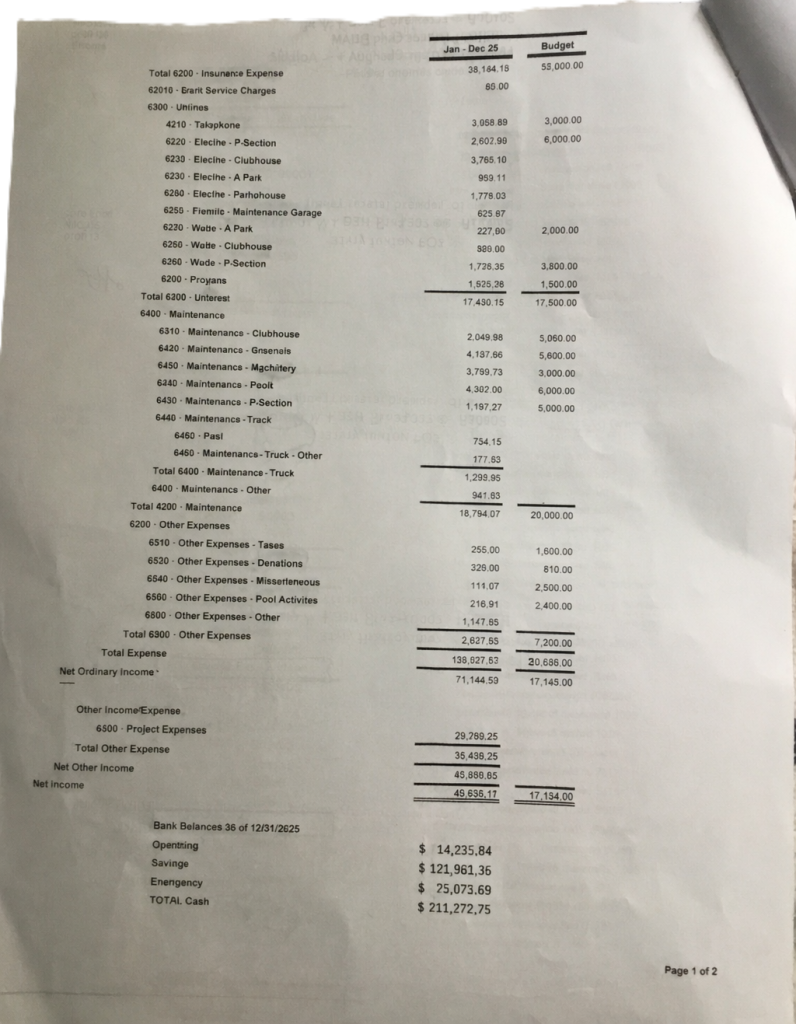
Snug Harbor ended 2025 with a net income of approximately $44,855, significantly higher than the budgeted figure. This positive variance suggests that the association managed expenses conservatively while maintaining steady income, providing added financial flexibility heading into the next fiscal year.
Assessment Revenue Outperformed Projections
Assessment income exceeded budgeted expectations, indicating healthy homeowner participation and effective collections. Strong assessment performance is one of the most important indicators of an association’s financial health, as it provides predictable funding for ongoing operations and long-term planning.
Payroll Costs Well Controlled
Payroll expenses came in well below budget, contributing meaningfully to the favorable year-end results. This suggests careful staffing decisions and effective oversight of labor costs, helping limit fixed expenses without disrupting overall operations.
Administrative and Professional Expenses Under Budget
Office and professional expenses were also significantly lower than anticipated. From a financial perspective, this points to cost awareness and restraint in administrative spending, which helped preserve cash and improve overall operating results.
Utilities and Maintenance Remained Stable
Despite ongoing inflation and rising service costs across many sectors, utilities and maintenance expenses remained close to budgeted levels. This consistency reflects accurate forecasting and proactive management of essential services and common-area upkeep.
Healthy Cash Reserves
At year-end, Snug Harbor reported over $211,000 in total cash reserves, including operating, savings, and emergency funds. Strong liquidity provides important protection against unexpected repairs, economic uncertainty, and future capital needs.
Supplemental Income Sources Performed Well
Revenue from amenities such as pool tags and rentals exceeded projections, providing additional support to the operating budget. Diversified income streams help reduce reliance on assessments alone and add flexibility to the association’s finances.
Overall Assessment
From an independent financial perspective, Snug Harbor’s 2025 results indicate:
- A stronger-than-expected year-end position
- Effective cost control in key operating areas
- Stable core revenues
- A solid cash foundation for future planning
While every association faces ongoing financial challenges, the 2025 Profit & Loss report reflects a year of sound financial management and favorable outcomes for the Snug Harbor community.
📊 Variance % Table with Risk Ratings
INCOME
| Category | Actual ($) | Budget ($) | Variance ($) | Variance % | Risk Rating | Notes |
|---|---|---|---|---|---|---|
| Assessments | 178,381 | 162,734 | +15,647 | +9.6% | 🟢 Low | Strong collections; favorable |
| Past Dues | 0 | 23,000 | -23,000 | -100% | 🟡 Medium | Budget assumption unreliable |
| Special Assessments | 4,449 | 2,500 | +1,949 | +78.0% | 🟡 Medium | Non-recurring income |
| Pool Tags (Total) | 5,935 | 4,565 | +1,370 | +30.0% | 🟢 Low | Stable ancillary income |
| Other Income (Total) | 7,112 | 21,790 | -14,678 | -67.3% | 🔴 High | Highly volatile & misbudgeted |
| Total Income | 206,667 | 218,389 | -11,722 | -5.4% | 🟡 Medium | Offset by expense underspend |
EXPENSES
| Category | Actual ($) | Budget ($) | Variance ($) | Variance % | Risk Rating | Notes |
|---|---|---|---|---|---|---|
| Payroll (Total) | 56,097 | 98,925 | -42,828 | -43.3% | 🔴 High | Likely understaffing or deferred labor |
| Office & Professional | 12,271 | 32,500 | -20,229 | -62.3% | 🔴 High | Deferred services/compliance risk |
| Insurance (Total) | 29,143 | 25,000 | +4,143 | +16.6% | 🟡 Medium | Structural cost pressure |
| Utilities | 17,451 | 17,300 | +151 | +0.9% | 🟢 Low | Well controlled |
| Maintenance (Total) | 16,794 | 20,000 | -3,206 | -16.0% | 🟡 Medium | Possible deferred maintenance |
| Other Expenses | 2,022 | 7,200 | -5,178 | -71.9% | 🔴 High | Budget not aligned with reality |
| Project Expenses | 26,289 | 0 | +26,289 | N/A | 🔴 High | Major governance red flag |
| Total Expenses | 135,522 | 201,225 | -65,703 | -32.6% | 🔴 High | Results driven by underspending |
BOTTOM LINE
| Metric | Actual ($) | Budget ($) | Variance ($) | Variance % | Risk |
|---|---|---|---|---|---|
| Net Ordinary Income | 71,145 | 17,164 | +53,981 | +314% | 🟡 |
| Net Income | 44,855 | 17,164 | +27,691 | +161% | 🟡 |
🚦 Risk Rating Legend
- 🟢 Low Risk – Stable, predictable, well-budgeted
- 🟡 Medium Risk – Manageable but needs monitoring
- 🔴 High Risk – Budget failure, governance issue, or future exposure